Catalogs#
The Catalog object is a core part of SeismoStats. It is based on a pandas.DataFrame, allowing to use both SeismoStats methods and native pandas tools to filter, change, and analyze earthquake data. In this chapter we give a short overview on
the structure of the
Catalog(Section 1)how to create a
Catalogobject (Section 2)visualizing earthquake catalogs with SeismoStats (Section 3.2)
estimating earthquake catalog parameters such as the magnitude of completeness, the b-value and the a-value (Section 3.3)
For a quick workflow using the Catalog class, see 10 minutes to Seismostats.
1 Structure#
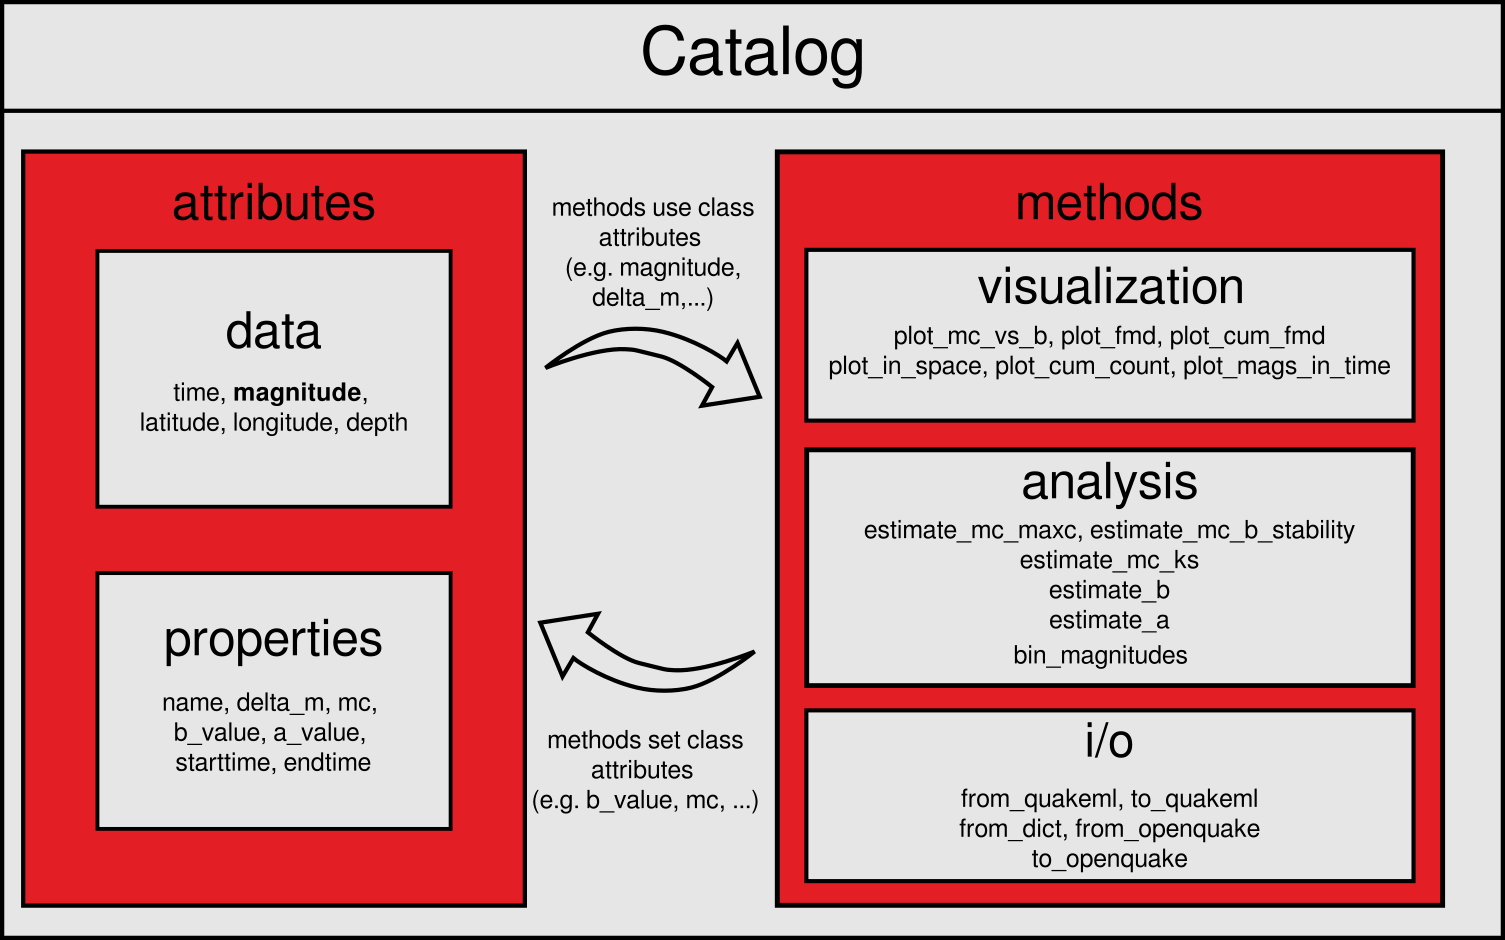
The Catalog class consists of a tabular structure with earthquake data, additional attributes for metadata and methods for visualization and statistical analysis. This combination allows for easy storage, organization, and analysis of event data.
Event data is stored in pandas.DataFrame, where each row represents a single event. The columns typically contain information such as origin time, magnitude, and event location.
At a minimum, a Catalog object must include a magnitude column. Common additional data columns include, but are not limited to:
timelatitudelongitudedepth
Beyond the tabular event data, the Catalog object also stores catalog metadata as attributes. These attributes can be both manually defined or autmatically set and updated by methods within the Catalog class. For a complete list of available attributes and their usage, see the Data Formats section.
2 Import and Export#
When working with earthquake data, event catalogs can take various forms:
As lists or arrays within a python program
Stored locally in different file formats (e.g. CSV, JSON, QuakeML)
Available from remote data servers or APIs
SeismoStats accommodates all of these scenarios. With its flexible methods for reading and writing earthquake catalogs, it’s easy to load external data, convert between formats, and export results in a format suitable for further analysis or sharing.
2.1 Initializing from Python Data Structures#
Here we demonstrate, how to create a Catalog object from scratch. This can be helpful, if you already have magnitudes in a list or numpy.array. As mentioned above, the Catalog object requires at least a column with magnitudes. Additional data, such as event times or hypocenter information, is beneficial for later analysis.
From a Dictionary#
The most direct method to create a Catalog object is done via a Python Dictionary:
>>> from seismostats import Catalog
>>>

>>> # Create a DataFrame with earthquake data
>>> dict_data = {
...    'longitude': [42.35, 1.35],
...    'latitude': [7.34444, 5.13500],
...    'depth': [5.50, 10.52],
...    'time': ['2022-01-01 05:05:13', '2022-04-07 07:07:15'],
...    'magnitude': [1.0, 2.5]
... }

>>> # Initialize a Catalog from an existing dictionary
>>> cat = Catalog(dict_data)

>>> # Preview the first entries
>>> cat.head()
    longitude   latitude    depth   time                magnitude
 0  42.35       7.34444     5.50    2022-01-01 05:05:13 1.0
 1  1.35        5.13500     10.52   2022-04-07 07:07:15 2.5
From a pandas DataFrame#
Since the Catalog object is based on the pandas.DataFrame() structure, it can be used for the creation of a new catalog.
>>> from seismostats import Catalog
>>> import pandas as pd

>>> # Create a DataFrame with earthquake data
>>> df = pd.DataFrame({
...    'longitude': [42.35, 1.35],
...    'latitude': [7.34444, 5.13500],
...    'depth': [5.50, 10.52],
...    'time': ['2022-01-01 05:05:13', '2022-04-07 07:07:15'],
...    'magnitude': [1.0, 2.5]
... })

>>> # Initialize a Catalog with from an existing dataframe
>>> cat = Catalog(df)

>>> # Preview the first entries
>>> cat.head()
    longitude   latitude    depth   time                magnitude
 0  42.35       7.34444     5.50    2022-01-01 05:05:13 1.0
 1  1.35        5.13500     10.52   2022-04-07 07:07:15 2.5
2.2 Reading and writing with external data formats#
Earthquake event catalogs are often available in various file formats. The following section provides a brief overview of how you can use SeismoStats with pandas’ native I/O capabilities (e.g., CSV, Excel, JSON), as well as with additional formats commonly used in the seismological community (e.g QuakeML).
Using pandas I/O#
Using pandas DataFrames is convenient because it provides built-in methods to read and write a wide range of formats, such as CSV, Excel, JSON, and HTML. Reading is typically done using pandas.read_<format>() formats, while writing is carried out with DataFrame.to_<format>() This makes it easy to load external data into a Catalog object and export it to other formats. For a full list of supported formats, refer to the pandas I/O documentation
The following example shows how a catalog can be imported from a CSV file and written to a JSON file.
>>> from seismostats import Catalog
>>> import pandas as pd

>>> # Reading the catalog from a CSV file
>>> csv_file = "/path/to/file.csv"
>>> df = pd.read_csv(csv_file)
>>> cat = Catalog(df)

>>> # Writing the catalog to a JSON file
>>> json_file = "/path/to/file.json"
>>> cat.to_json(json_file)
QuakeML#
Reading and writing from and to data in QuakeML format can easily be done by using from_quakeml and to_quakeml. For more information on the QuakeML data structure refer to the
QuakeML documentation.
Warning: Be aware that the output of
to_quakemlis a formatted string. For creating a new file, the string has to be saved as shown in the example below.
>>> quakeml_file = "/path/to/quakeml_file.xml"
>>> # Read catalog data
>>> cat = Catalog.from_quakeml(quakeml_file)

>>> # Write Catalog data to QuakeML format
>>> quakeml_output = "/path/to/quakeml_output.xml"

>>> # convert catalog to QuakeML format:
>>> cat_quakeml = cat.to_quakeml()

>>> # save QuakeML catalog to a file
>>> with open(quakeml_output, 'w') as f:
...    f.write(cat_quakeml)
OpenQuake#
In contrast to the previous methods, from_openquake and to_openquake don’t read and write from and to external files, but convert the OpenQuake Catalogue object to a Seismostats Catalog and vice versa. An introduction to OpenQuake with information on the installation process can be found in the OpenQuake documentation.
Note: For working with OpenQuake catalogs, the respective python package has to be installed in addition to SeismoStats.
>>> from openquake.hmtk.seismicity.catalogue import \
...     Catalogue as OQCatalog
>>> from seismostats import Catalog

>>> # Create OpenQuake Catalogue:
>>> oq_cat = OQCatalog.make_from_dict({
...     'eventID': ["event0", "event1", "event2"],
...     'longitude': np.array([42.35, 1.35, 2.35], dtype=float),
...     'latitude': np.array([3.34444, 5.135, 2.134],
...                          dtype=float),
...     'depth': np.array([5.5, 10.52, 50.4], dtype=float),
...     'year': np.array([1900, 1982, 2020], dtype=int),
...     'month': np.array([1, 4, 11], dtype=int),
...     'day': np.array([1, 7, 30], dtype=int),
...     'hour': np.array([5, 7, 12], dtype=int),
...     'minute': np.array([5, 7, 30], dtype=int),
...     'second': np.array([13.1234, 15.0, 59.9999],
...                        dtype=float),
...     'magnitude': np.array([1.0, 2.5, 3.9], dtype=float)
...     })

>>> # Convert OpenQuake Catalogue to SeismoStats Catalog:
>>> cat = Catalog.from_openquake(oq_cat)
>>> cat.head()
longitude   latitude  depth                time  magnitude
                0      42.35    3.34444   5.50 1900-01-01 05:05:13        1.0
                1       1.35    5.13500  10.52 1982-04-07 07:07:15        2.5
                2       2.35    2.13400  50.40 2020-11-30 12:30:59        3.9

>>> # Convert SeismoStats Catalog to OpenQuake Catalogue:
>>> oq_cat_converted = cat.to_openquake()
2.3 Downloading from Remote Services#
By using the built-in FDSN client, event data can be directly downloaded from FDSN servers such as EIDA and USGS.
Warning: FDSN servers often impose limits on the number of events returned per request. If too much data is requested at once, you may encounter a
TimeOutError. To avoid this, use thebatch_sizeargument, to limit the number of events retrieved per request.
The following example shows how to download an earthquake catalog of Switzerland from EIDA.
>>> from seismostats.catalogs.client import FDSNWSEventClient
>>> from seismostats import Catalog
>>> import pandas as pd

>>> # Define time range and region of interest
>>> start_time = pd.to_datetime('2020/01/01')
>>> end_time = pd.to_datetime('2022/01/01')

>>> min_longitude = 5
>>> max_longitude = 11
>>> min_latitude = 45
>>> max_latitude = 48

>>> min_magnitude = 0.5
>>> url = 'http://eida.ethz.ch/fdsnws/event/1/query'
>>> client = FDSNWSEventClient(url)

>>> # Download events
>>> cat = client.get_events(
...     start_time=start_time,
...     end_time=end_time,
...     min_magnitude=min_magnitude,
...     min_longitude=min_longitude,
...     max_longitude=max_longitude,
...     min_latitude=min_latitude,
...     max_latitude=max_latitude,
...     batch_size=1000)

>>> # Create catalog and preview entries
>>> cat.head()
  event_type             time                  latitude  longitude      depth evaluationmode  magnitude magnitude_type  magnitude_MLhc  magnitude_MLh
0  earthquake  2021-12-30 07:43:14.681975   46.051445   7.388025  1181.640625        manual   2.510115           MLhc     2.510115344            NaN
1  earthquake  2021-12-30 01:35:37.014056   46.778985   9.476219  9294.921875        manual   1.352086           MLhc     1.352086067            NaN
2  earthquake  2021-12-29 08:48:59.059653   47.779511   7.722354 16307.812500        manual   0.817480           MLhc     0.8174796651           NaN
3 Working with a catalog#
By using analysis and plotting functions as methods of the Catalog object, relevant parameters stored as attributes (such as mc or b_value) are automatically accessed. This simplifies the workflow by reducing the need to repeatedly specify arguments manually.
3.1 Setting additional attributes#
These attributes can both be set manually by the user or they are estimated by catalog methods.
For example the precision of the magnitudes delta_m, can be explicitly set by the user:
>>> # Define the catalog attribute delta_m
>>> cat.delta_m = 0.1
This attribute is then automatically used by methods like bin_magnitudes which bins the catalog magnitudes based on the given precision.
>>> # No additionaly argument delta_m is necessary
>>> cat.bin_magnitudes()
Alternatively, delta_m can be passed directly as an argument to methods like bin_magnitudes. In that case, the value passed will override the current value stored in the catalog’s delta_m.
# Current delta_m of the catalog
>>> print(cat.delta_m)
0.1

# Bin the catalog with a new delta_m
>>> cat.bin_magnitudes(delta_m=0.2)

# The catalog attribute delta_m changed
>>> print(cat.delta_m)
0.2
3.2 Visualization#
As described in the Plotting guide, SeismoStats offers a variety of methods for visualising catalog data in space and time. Furthermore magnitude distributions can be plotted to get a first impression on the catalog parameters. The following methods are directly available as Catalog methods:
Here, we show some examples how the plotting methods can be used. The methods access the data and attributes of the Catalog class and additional parameter can be passed as arguments.
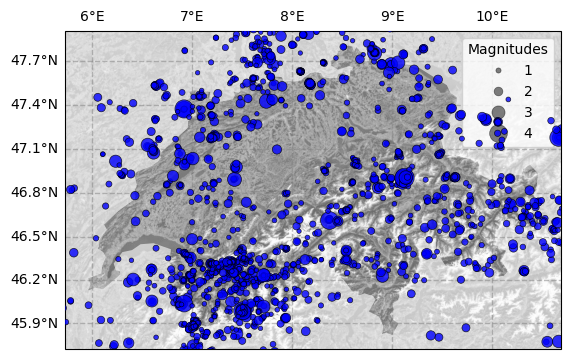
Seismicity Map#
If the catalog contains information on the event location (latitude, longitude) in addition to the magnitude column, the seismicity can be plotted spatially:
>>> cat.plot_in_space(
      resolution='10m',
      include_map=True,
      country='Switzerland',
      color_dots="blue",
      color_map='Greys_r',
      dot_labels=[1, 2, 3, 4],
      )
For a modification of the map layout (e.g. color of marker, background, labels) refer to the method description in the API
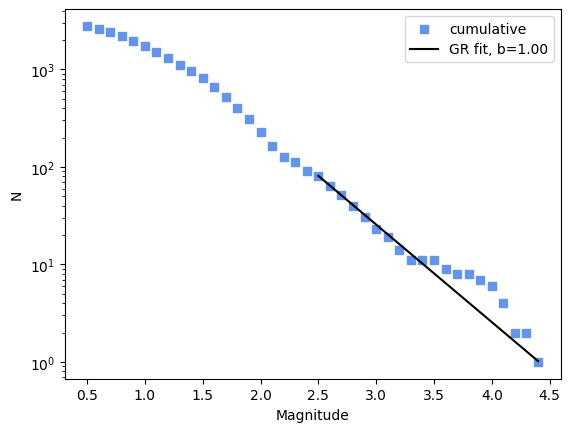
Cumulative frequency-magnitude distribution#
For showing the cumulative frequency-magnitude distribution with plot_cum_fmd() the bin size fmd_bin has to be chosen. If additionally, the b_value and mc are passed as arguments (or are available as catalog attributes), the Gutenberg-Richter fit is shown.
>>> cat.plot_cum_fmd(fmd_bin=0.1, b_value=1.0, mc=2.5, color="cornflowerblue", color_line="black")

>>> # Same as:
>>> cat.b_value = 1.0
>>> cat.mc = 2.5
>>> cat.plot_cum_fmd(fmd_bin=0.1, color="cornflowerblue", color_line="black")
More examples for visualization can be found in the Plotting guide.
3.3 Estimation of earthquake catalog parameter#
SeismoStats primarily focuses on determining earthquake catalog parameters such as magnitude of completeness, b-value and a-value. For each of these parameters, the platform offers a selection of established methods used within the seismological community. Detailed descriptions of these methods and their application can be found in the corresponding sections of the User Guide. Here we give a quick overview, how those methods can be used together with the Catalog class.
We will use the Switzerland catalog (downloaded via EIDA, see above) for the code examples. Magnitudes are binned before the analysis:
>>> cat.bin_magnitudes(delta_m=0.1, inplace=True)
Magnitude of Completeness#
The following methods to estimate Mc are available in SeismoStats:
Maximum Curvature:
estimate_mc_maxc()K-S distance:
estimate_mc_ks()B-value stability:
estimate_mc_b_stability()
These methods require the catalog to contain magnitudes. Some methods also take additional arguments for tuning the analysis.
For example the Maximum Curvature method requires the parameter fmd_bin, which is passed as an argument:
>>> cat.estimate_mc_maxc(fmd_bin=0.1)
>>> cat.mc
np.float64(1.0)
For the estimation of Magnitude of Completeness via the K-S test, the argument p_value_pass can be set (the internal default is 0.1). This parameter is the threshold of the p-value for rejecting the hypothesis of an exponential distribution. The larger the threshold, the more conservative the estimation. Additionally, the argument delta_m is required, which is either taken from the catalog’s attributes or can be passed directly.
>>> # Pass delta_m directly and use a threshold p_value_pass of 0.05
>>> cat.estimate_mc_ks(delta_m =0.1, p_value_pass=0.05)
>>> cat.mc
np.float64(1.5)

>>> # If delta_m was set before:
>>> cat.estimate_mc_ks(p_value_pass=0.05)
>>> cat.mc
np.float64(1.5)

>>> # Uses default threshold (0.1) and catalog delta_m (if set before)
>>> cat.estimate_mc_ks()
>>> cat.mc
np.float64(2.1)
Note: This method is slower due to testing multiple distribution hypotheses.
For more details, please referto the section in the User Guide.
b-value#
In addition to the classical method of Tinti and Mulargia (1987) for b-value estimation, SeismoStats includes the method of Utsu (1965) as well as so-called positive methods (e.g. Van der Elst (2021)). The latter consider magnitude differences above a specific threshold for the b-value analysis to account for the impact of short-term incompleteness. Within the code, the approach can be chosen by one of the following BValueEstimator classes:
For the catalog method cat.estimate_b() the classical method is chosen as a default and the analysis can be quickly carried out with:
>>> # Pass delta_m and mc directly
>>> cat.estimate_b(delta_m =0.1, mc=2.1)
>>> cat.b_value
np.float64(0.8742014183805725)

>>> # If delta_m and mc are were set before:
>>> cat.estimate_b()
>>> cat.b_value
np.float64(0.8742014183805725)

>>> # Test different mc's
>>> cat.estimate_b(mc=1.5)
>>> cat.b_value
np.float64(1.0294257342907407)
>>> # The catalog attribute mc is not changed!
>>> cat.mc
np.float64(2.1)
To use an alternative method for estimating the b-value, simply pass one of the estimator classes listed above as the method argument to estimate_b()
Note: The positive methods require additional arguments:
times: the origin time of the earthquake (typicallycat.time)
dmc: the threshold of magnitude differencesIf no arguments are not provided, it is assumed that the catalog events are already sorted by time and the value of
delta_mis used fordmc.
>>> # e.g. import BPositiveBValueEstimator
>>> from seismostats.analysis import BPositiveBValueEstimator
>>> estimator = BPositiveBValueEstimator

>>> # use the estimator as an argument in cat.estimate_b()
>>> cat.estimate_b(method=estimator, times=cat.time, dmc=0.1)

>>> #b-value determined with the b-positive method:
>>> cat.b_value
np.float64(0.9370272129061623)
More information on the different methods can be found in the b-value section of the the User Guide.
a-value#
Similar to the b-value analysis, SeismoStats contains the positive methods in addition to the classical approach. The estimation of the a-value can be carried out with the AValueEstimator classes:
Also the estimation of the a-value follows the procedure described in the b-value paragraph. As a default method for estimate_a() the classical approach is implemented:
>>> # Pass delta_m and mc directly
>>> cat.estimate_a(delta_m =0.1, mc=2.1)
>>> cat.a_value
np.float64(2.2121876044039577)

>>> # If delta_m and mc are were set before:
>>> cat.estimate_a()
>>> cat.a_value
np.float64(2.2121876044039577)

>>> # Test different mc's
>>> cat.estimate_a(mc=1.5)
>>> cat.a_value
np.float64(2.90687353472207)
>>> # The catalog attribute mc is not changed!
>>> cat.mc
np.float64(2.1)
To use a different AValueEstimator class, simply import the desired estimator and pass it as the argument method to estimate_a():
>>> # e.g. import APositiveAValueEstimator
>>> from seismostats.analysis import APositiveAValueEstimator
>>> estimator = APositiveAValueEstimator

>>> # use the estimator as an argument in cat.estimate_a()
>>> cat.estimate_a(method=estimator, times=cat.time, dmc=0.1)

>>> #a-value determined with the a-positive method:
>>> cat.a_value
np.float64(2.2320613684203283)
Please refer to the a-value section of the the User Guide for more information on the methods.